Compare Scenarios Definitions and Use Cases
This article is focused on detailed definitions and use cases to ensure you're comfortable with the assumptions and calculations in the Compare Scenarios feature.
For an overview of creating a scenario comparison, you'll find steps in our Comparing Scenarios article or you can review the 10-minute video below.
In this article:
- 1
-
Metric definitions
Within the new Scenario Comparison tool there are 29 metrics available to choose from for your analysis. The following definitions are intended to help you decide which metrics you'd like to include and how to make reference to any of the values.
- a
-
Primary metrics
Primary metrics include Summary and Cumulative metrics to help understand what's happening throughout the scenario(s). Summary metrics (e.g., Retirement Age, Projection End Age) will not be impacted by the selected From and To values in the top-right corner of the modal since these describe the projection settings. Cumulative metrics (e.g., Lifetime Personal Tax, Lifetime Government Benefits) will be impacted and will display the total during the year(s) specified by the From and To values.

- Goal Progress - The available cash flow in retirement divided by the desired retirement spending. This does not factor in the value held in Corporations or Real Assets. This is not impacted by the selected From and To values.
- Retirement Age - The first year that a client is indicated to retire based on the Scenario Setup -> General page. This is not impacted by the selected From and To values.
- Projection End Age - The final year of the projection based on the Scenario Setup -> General page. This is not impacted by the selected From and To values.
- Retirement Spending - Annual average Base Expenses in retirement during the year(s) specified by the From and To values.
- Lifetime Expenses - Total Base Expenses and Additional Expenses during the year(s) specified by the From and To values.
- Lifetime Personal Tax - Total Federal and Provincial taxes paid during the year(s) specified by the From and To values.
- Lifetime Corporate Tax - Total tax paid by the corporation(s) on Business Income and Taxable Investment Income during the year(s) specified by the From and To values. Calculated as Part I and Part IV Federal Tax plus Provincial Tax minus dividend refunds.
- Lifetime Government Benefits - Total CPP/QPP and OAS (net of any applicable clawback) during the year(s) specified by the From and To values.
- Lifetime OAS Clawback - Total OAS Clawback during the year(s) specified by the From and To values.
- b
-
Personal Estate metrics
All Personal Estate metrics are calculated as of the To Age/Year selected in the top-right corner of the Scenario Comparison modal. You can change this setting to view the estate information for different years of the projection.

- Financial Assets - The total of Financial Assets (RRSP, TFSA, LIRA, DCPP, Non-Registered) plus any positive Cash Balance, before tax.
- Real Assets - The total of all Real Assets, before tax.
- Total Assets - Financial Assets plus Real Assets.
- Debts - Total of all Debts plus any negative Cash Balance.
- Corporations - The portion of the Corporate After-Tax Estate Value allocated to the client and/or spouse at the end of any given year based on the specified ownership of the Corporation(s) on the Scenario Setup -> Corporations page.
- Insurance Proceeds - The Death Benefit of personal insurance where the beneficiary has been assigned as the Estate or Spouse. Insurance proceeds with a beneficiary of Other will not be included here and insurance proceeds for corporate-owned insurance are not included here.
- Estate Before Tax - Total Assets plus Corporations plus Insurance Proceeds minus Debts.
- Tax on Estate - Total tax paid on the estate. This includes the tax on the disposition of registered assets (RRSP, LIRA, DCPP), and any capital gains realized on the liquidation of Financial Assets and Real Assets. It also includes the tax on the disposition of the corporation.
- The estate tax is calculated as follows. All assets are deemed sold on December 31st at 11:59 pm (last year of projections). Then, the estate tax is paid.
- No probate fees are included.
- The estate tax is paid in addition to the tax paid on the Taxable Income in that year.
- Estate After Tax - The value of the estate after paying all taxes.
- This value does not include any consideration for probate fees.
- c
-
Corporate Estate metrics
All Corporate Estate metrics are calculated as of the To Age/Year selected in the top-right corner of the Scenario Comparison modal. You can change this setting to view the estate information for different years of the projection.
- Net Worth - Corporate Financial Assets plus Real Assets less any Debts. The Cash Balance (if applicable) is added if it's a positive balance or subtracted if it's a negative balance.
- Tax on Disposition - Capital Gains taxes due to the liquidation of Financial Assets and Real Assets.
- Dividend Refund - RDTOH that will be refunded to the corporation due to the dividend distributions to the estate.
- Market Value - The Net Worth less Tax on Disposition plus the Dividend Refund.
- Insurance CSV - The total Cash Surrender Value of all in-force insurance policies.
- Insurance Proceeds - The Death Benefit of corporate insurance policies.
- After Tax Estate Value - The Market Value less Insurance CSV plus Insurance Proceeds.
- Return of Capital - The amount of the After Tax Estate Value that is distributed to the personal estate as return of capital. Calculated based on the Paid-Up Capital on the Scenario Setup -> Corporation page.
- Capital Dividends - The amount of the After Tax Estate Value that is distributed to the personal estate as capital dividends. Calculated based on the CDA at the time of the estate, which includes existing CDA plus CDA generated from capital gains on the disposition of Financial Assets and Real Assets as well as any CDA generated from Insurance Proceeds net of the Cost.
- Eligible Dividends - The amount of the After Tax Estate Value that is distributed to the personal estate as eligible dividends. Calculated based on the GRIP and Eligible RDTOH balances at the time of the estate.
- Non-Eligible Dividends - The amount of the After Tax Estate Value that is distributed to the personal estate as non-eligible dividends. Calculated based on the remaining cash to distribute to the estate.
- 2
-
Use cases
There are three main use cases for the Scenario Comparison tool.
Use Case 1 - Single Scenario Summary
You can summarize a single scenario across anywhere from 1 to 29 metrics to provide the client with a better understanding of the projection. In this case, you would select Compare Scenario and then check the box just for the scenario you're interested in.

You can then customize what Metrics you'd like to include before generating a digestible summary of the projection. These new Metrics provide a complement to the Planning pages and Client Reports to help digest what's happening.

Use Case 2 - Two Scenario Difference
You can illustrate the differences between two scenarios across anywhere from 1 to 29 metrics to provide the client with an understanding of the impact different decisions will make or to demonstrate the value that you're providing to their financial situation. In this case, you would select Compare Scenario and then check the box for the two scenarios you're interested in. Typically this would include the base scenario (often what they're doing now) and an alternative scenario or recommended scenario.

You can then customize what Metrics you'd like to include before discussing the Difference column. You can highlight where there are benefits (e.g., increased Estate After Tax) and note that this does not come at the expense of reduced spending (i.e., the Lifetime Expenses remain constant in both projections).

Use Case 3 - Three to Five Scenario Comparison
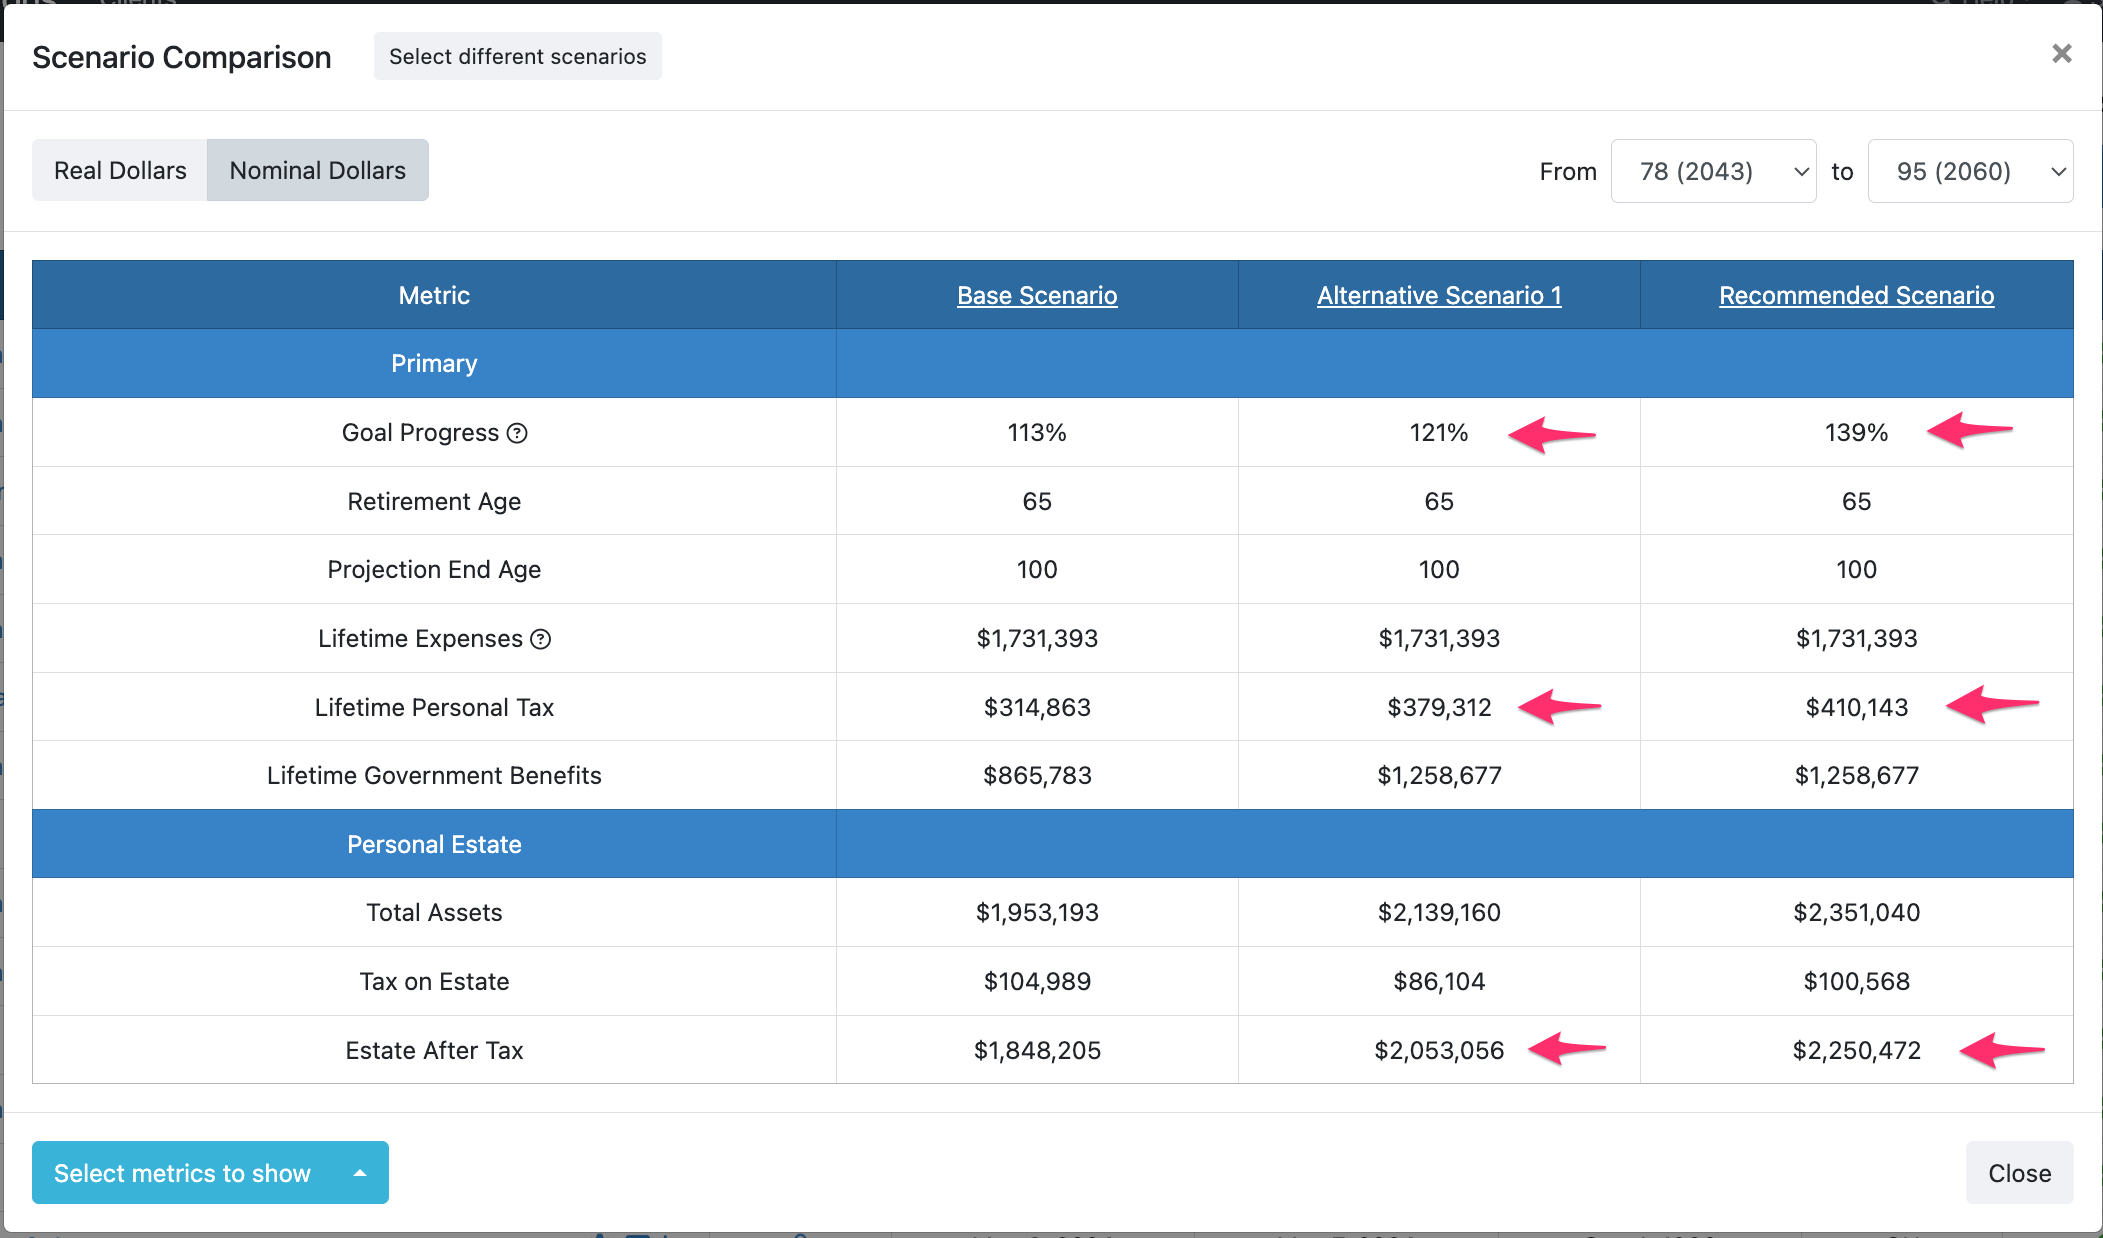
You can review three to five scenarios across anywhere from 1 to 29 metrics to provide the client with a detailed view of how different decisions will impact their financial circumstances moving forward. Having many scenarios can also facilitate important discussions that may otherwise be difficult without the data readily available. In this case, you would select Compare Scenario and then check the box for the three to five scenarios you're interested in.

You can then customize what Metrics you'd like to include before discussing the results. You can show the client that while their Lifetime Taxes have increased in the alternative and recommended scenarios, their Goal Progress and Estate After Tax have still improved. This can help decide what metrics are most important and should be optimized for.