What's New?
To enlarge this article to full screen (if you are viewing it in a small window), please click the title of the article.
We're continually making improvements to Snap Projections and many of the changes originate from customer suggestions. We greatly value hearing your feedback and encourage you to let us know what would make Snap Projections more valuable for you. You can send your comments to [email protected] - we are listening!
September 30, 2026 - Release Notes - Investment Management Fees and Linking to General Inflation
| Summary: |
|---|
- New Features
You can now enter default Management Fees on the Scenario Setup -> General page.
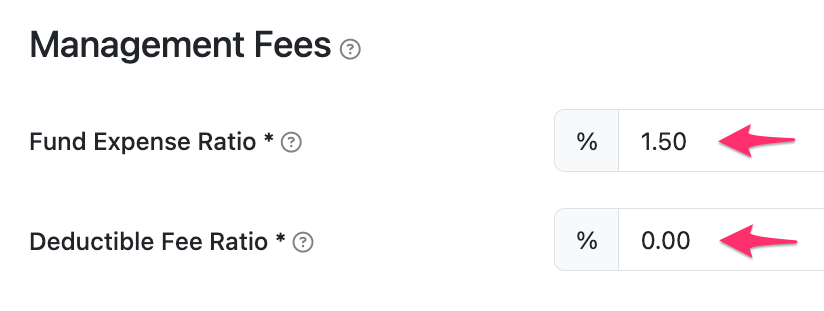
These will apply to all new Financial Assets added to the projection. For any existing Financial Assets, you can adjust them directly on the Scenario Setup -> Assets -> Fees page.
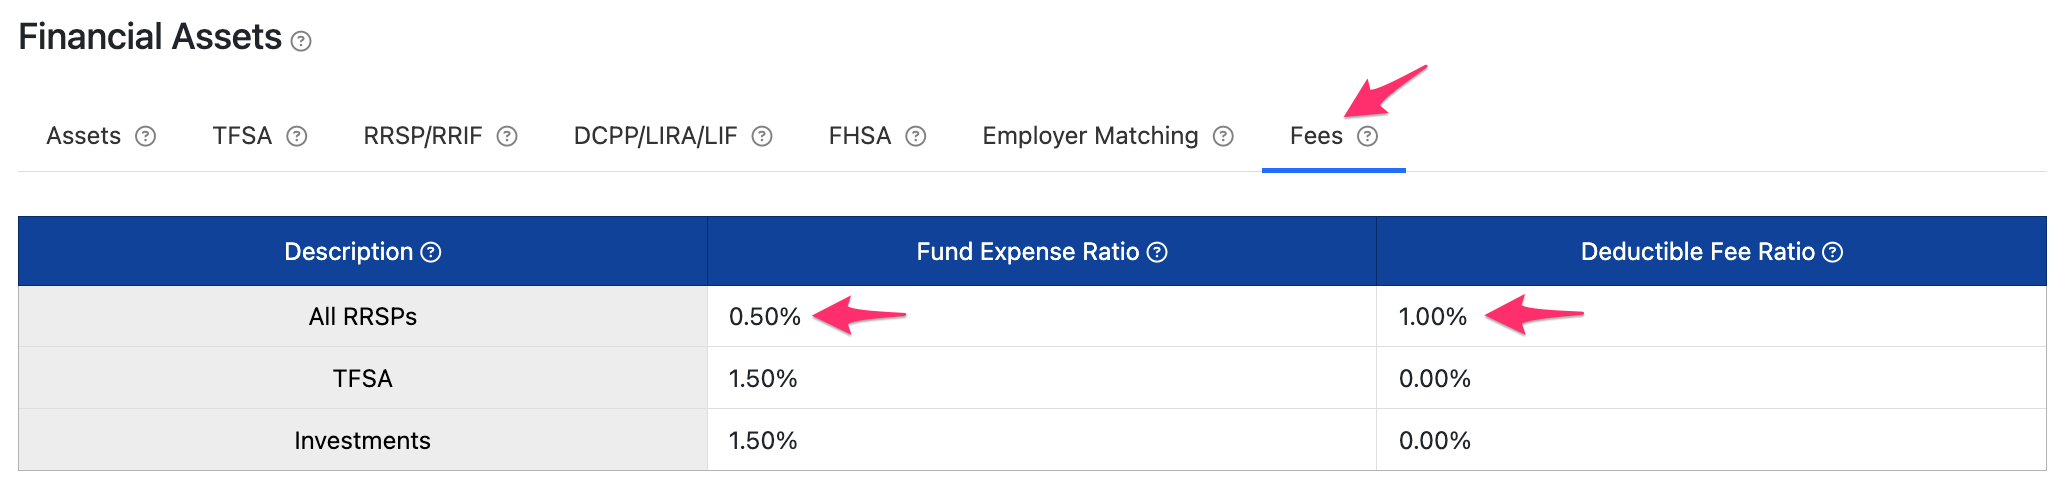
Fund Expenses (e.g., MER, TER) are subtracted from the gross returns before calculating investment income (e.g., interest, dividends, capital gains).
Deductible Fees (e.g., advisory fees) are paid after investment income has been calculated.

The Deductible Fees for non-registered assets are added to any other Deductions for the year (e.g., tax-deductible interest expense, CPP enhancement deductions) in the Taxable Income Details table and are included in the Carrying charges and interest expense in the Income Tax Details table.


Management Fees have been set to 0% for all existing scenarios, so your projections will not be impacted by this change. If you wish, you can begin using Management Fees by updating the Scenario Setup -> General page and Scenario Setup -> Assets -> Fees page mentioned above.
If you begin using the Management Fees settings, you'll also want to adjust your Rates of Return settings to set them back to the gross return assumptions provided by the FP Canada Projection Assumptions Guidelines or your preferred source. You can import the latest guidelines by clicking Use Guidelines at the top of the Scenario Setup -> General page. A reminder that this only changes the general settings for new Financial Assets added to the projection. You'll need to update any existing Financial Assets directly on the Scenario Setup -> Assets page.


Additional details on Management Fees are available in our dedicated article.
- Enhancements
You can now link additional inputs to the General Inflation Rate in your projections by deleting the input in the Indexing/Inflation/Appreciation field.

Previously, you could link Incomes and Expenses directly to the General Inflation Rate. This is helpful in case you manually change the General Inflation Rate in the future and for Stress Testing Scenarios (e.g., Monte Carlo, Historical) where the General Inflation Rate automatically fluctuates on an annual basis.

You can now link the following inputs to the General Inflation Rate:
- Incomes
- Additional Expenses
- Defined Benefit Pension Plans (NEW)
- Real Assets (NEW)
- CPP/QPP (NEW)
- OAS (NEW)

You can now use authenticator apps for multi-factor authentication (MFA) in Snap
From your User Settings page you can enable MFA and then select whether you want to use an Authenticator app (e.g., Google Authenticator, Microsoft Authenticator) to receive a six digit code when signing into Snap Projections.

More information on enabling and disabling MFA is available in our dedicated article.
- Webinar and Q & A Sessions
📉 Improve client outcomes with Monte Carlo analysis (August 26, 2026)
During the webinar, we demonstrated how to:
- Stress test your projections to understand the range of potential future outcomes.
- Discuss strategies to address downside risk proactively.
- Illustrate the importance of ongoing planning work to adapt over time.
- Provide strategies that can be applied in the future as needed.
🎯 Optimize client outcomes with automated recommendations, without losing control (June 17, 2026)
During this webinar, we reviewed several projections to demonstrate how to:
- Generate automatic recommendations to help answer client questions and improve their outcomes.
- Tailor the recommendations based on unique circumstances and preferences.
- Review and understand the resulting projection and the pros and cons of the recommendations.
- Provide actionable next steps for your client to implement the recommendations.
Q & A Sessions
Join us at one of our upcoming Q & A sessions, where we typically review new features and create a basic plan.
We're also available for one-on-one support by phone, email, and screen sharing. Reach out to us at [email protected] or 1-888-758-7977 Option 1.
| Back to top |