Modelling the Guaranteed Income Supplement (GIS)
This article details the steps to model the GIS in your projections. The GIS can be added as a non-taxable income and adjusted over the years based on the individual's other income.
In this article:
- What is the Guaranteed Income Supplement (GIS)?
- Determining the GIS benefit amounts
- How to include the GIS benefit in your projections
- Example cases in Snap Projections for a single individual:
- No employment or self-employment income
- With both employment and self-employment income
- With income that changes over the course of the projections
- Prefer to watch a video (15min)?
- 1
-
What is the Guaranteed Income Supplement (GIS)?
In addition to the Old Age Security pension (OAS), your client may qualify for the Guaranteed Income Supplement (GIS), a non-taxable income that is based on income and is available to low-income Old Age Security pensioners. Payment amounts for this benefit are based on factors including age, place of residence, marital status, and other income.
Snap Projections does not automatically calculate GIS in your projections for a few reasons including the following:
- the calculations are complex, involving a government data table that has over 5,000 rows of data which is updated quarterly;
- the dependency of the GIS amount on marital status, age, other income;
- the feedback that we have received from users is that GIS is rarely a factor in their projections.
- 2
-
Determining GIS benefit amounts
To find GIS benefit amounts you can refer to this Government of Canada website.
For example, for a single person receiving a full OAS pension, the maximum GIS amount between April to June 2024 is $1,065.47/month. To receive this maximum GIS amount, their income (excluding OAS, GIS, or Allowance payments) must be less than $24. If their income is between $24 and $21,624 annually they'll receive a partial GIS payment with the amount decreasing as their income increases. If their income is above $21,624 then they're not eligible for GIS.
A Service Canada form is available which lists the various income types that are included in the income threshold calculation for GIS eligibility. Note that there is also an earnings exemption and the Instruction Sheet in this form provides details about this under Section E, Blocks 7 and 8. Effective July 2020, the first $5,000 of employment or self-employment income is exempt when determining GIS. In other words, there is no clawback on GIS based on the first $5,000 of employment income. On the next $10,000 of employment or self-employment income, there is a partial exemption of 50% beyond the $5,000 threshold. This means there is only half the normal rate of clawback on the GIS in this range.
Once you have estimated the GIS benefit your client is likely to be eligible for, you can add it to the projections.
- 3
-
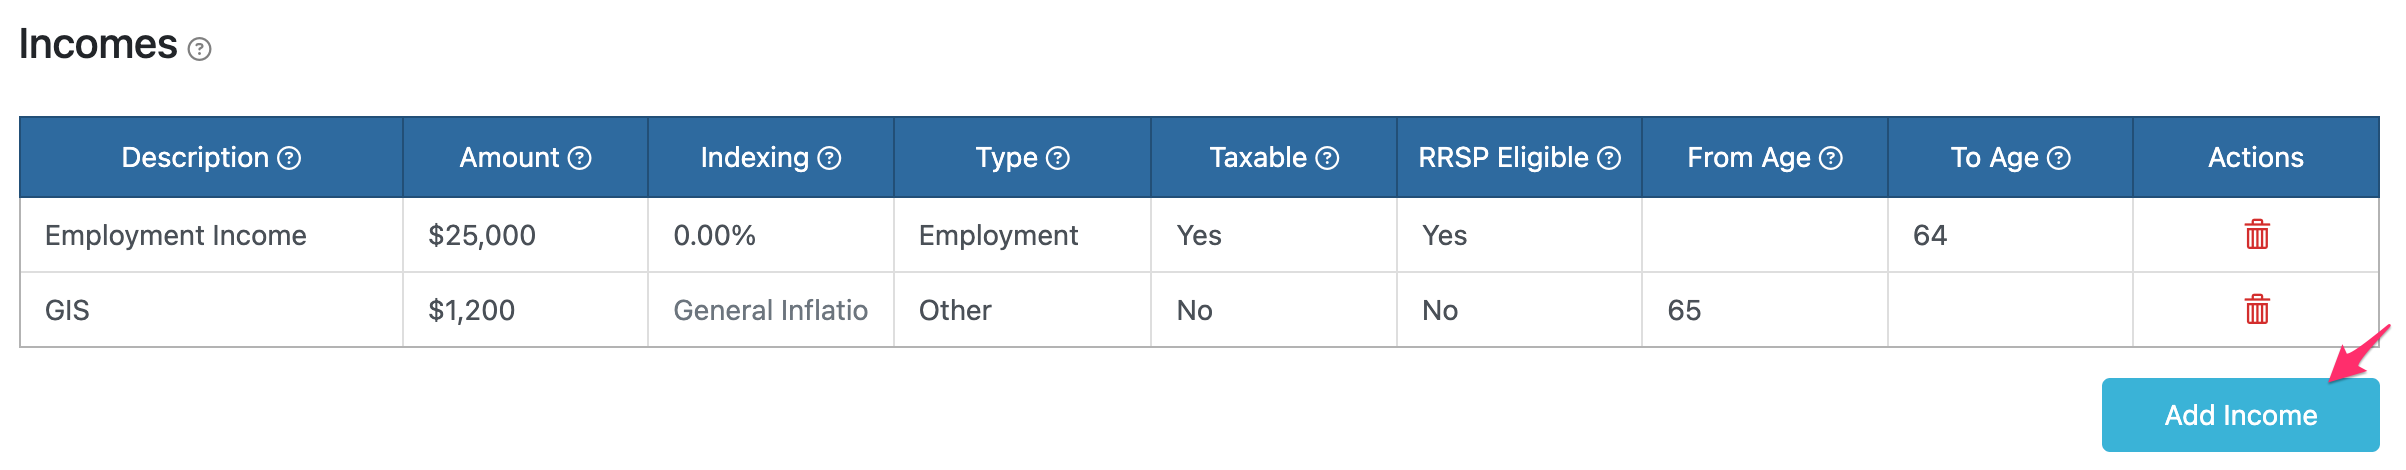
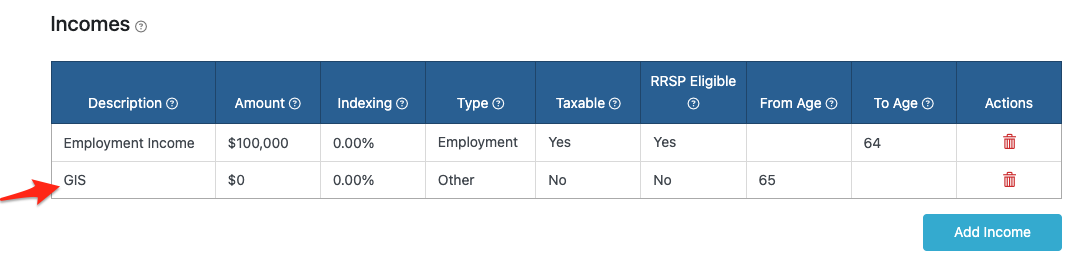
How to include the GIS benefit in the projections
|
|
|
|
- 4
-
Example cases in Snap Projections for a single individual
Example A: No employment or self-employment income.
Our first example is for a single person named Salvatore who receives $16,000 a year of income from a combination of CPP and RRIF income. He also receives his OAS pension, and this is not included in the calculation of his GIS benefit. Here are the projections for Salvatore before we include GIS.

To determine the GIS benefit that Salvatore is eligible for, we can use his Taxable Income minus his OAS pension which is excluded from his yearly income for GIS eligibility.
Yearly Income (excluding OAS Pension and GIS) = Taxable Income - OAS = $23,384 - $7,384 = $16,000
Using the Gov't Benefits table, that correlates to a GIS amount of $135.86/month or $1,630.32/year.

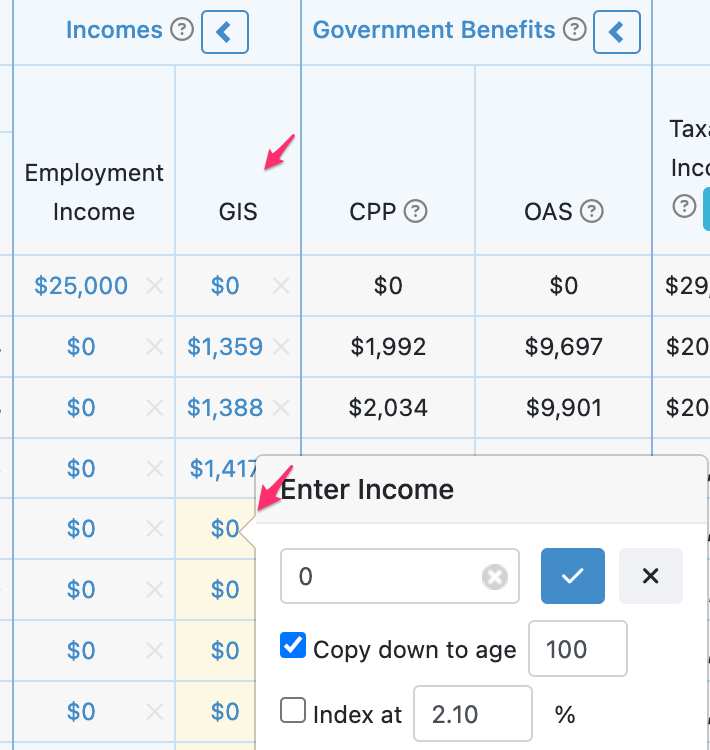
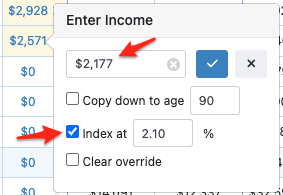
In the projections, we add that amount as a non-taxable income for Salvatore, indexed at 2%. Note that the incomes entered for GIS will be highlighted in yellow in Snap since they are considered an override from the $0 value entered for the amount under Scenario Setup -> Income. (The images captured below do not show the yellow highlighting because the screen captures were taken using a previous version of Snap.)

Example B: With both employment and self-employment income
When calculating the GIS clawback, the first $5,000 employment or self-employment income has no bearing. On the next $10,000 of employment or self-employment income, there is only half the normal rate of clawback. This example will provide an illustration.
Annette currently receives $16,000 per year of income from the following sources:
- $4,000 from CPP
- $7,000 from employment
- $5,000 from self-employment
Annette's GIS clawback will be based on:
- $4,000 from CPP
- $1,000 from employment, (a $5,000 exemption, and then the next $2,000 only gets ½ the normal clawback)
- $2,500 from self-employment (only ½ the normal clawback applies)
Annette will have a GIS clawback based on $7,500 of income, even though her income is $16,000/yr from the above sources.

Let's take a look at this in Snap Projections. Since the yearly income for GIS eligibility disregards OAS income, we can make the following calculation for the first year of the projections:
Yearly Income (excluding GIS and OAS) =
+ $23,532 Taxable Income
- $5,000 exemption for $7,000 of employment income
- $1,000 50% exemption on the remaining $2,000 of employment income
- $2,500 50% exemption on the $5,000 of self-employment income
- $7,532 OAS
= $7,500
Using the Gov't Benefits table, yearly income for a single person correlates to a GIS amount of $522.82/month or $6,274/year. We add that to the projections as a non-taxable income stream, indexed each year.


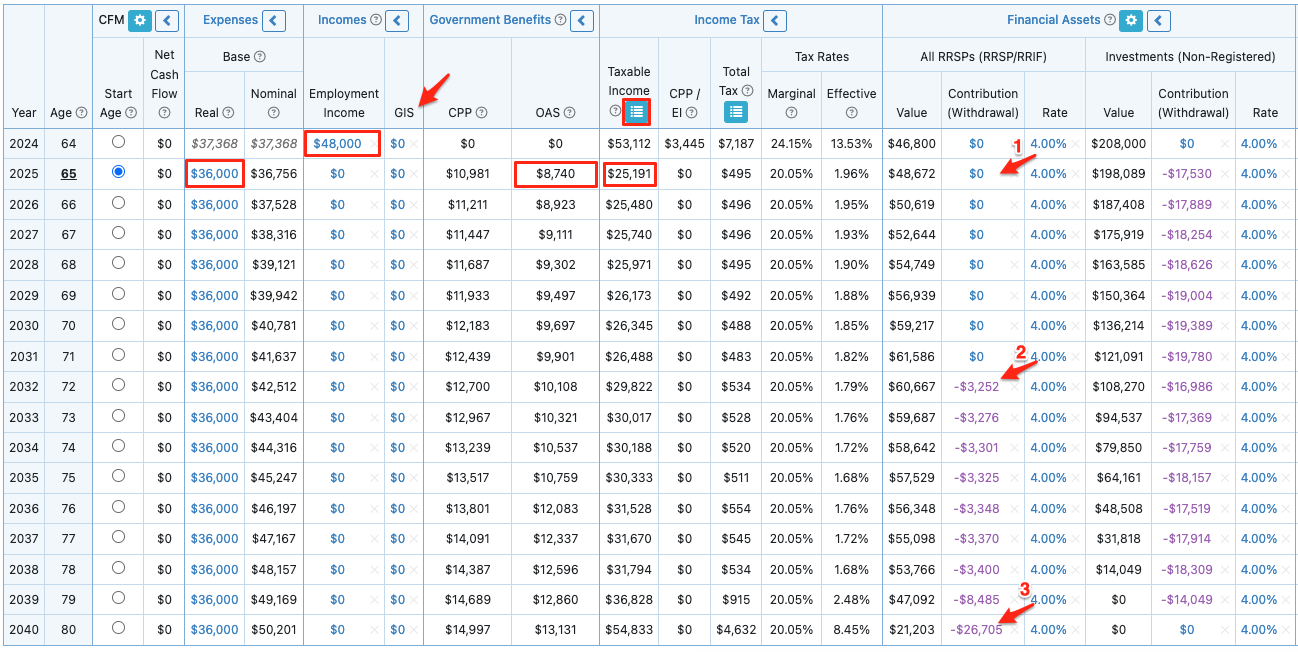
Example C: With income that changes over the course of the projections
Below, we will walk through a longer example to illustrate how to estimate the GIS amount that your client will be eligible for and then include this in the projections in future years.
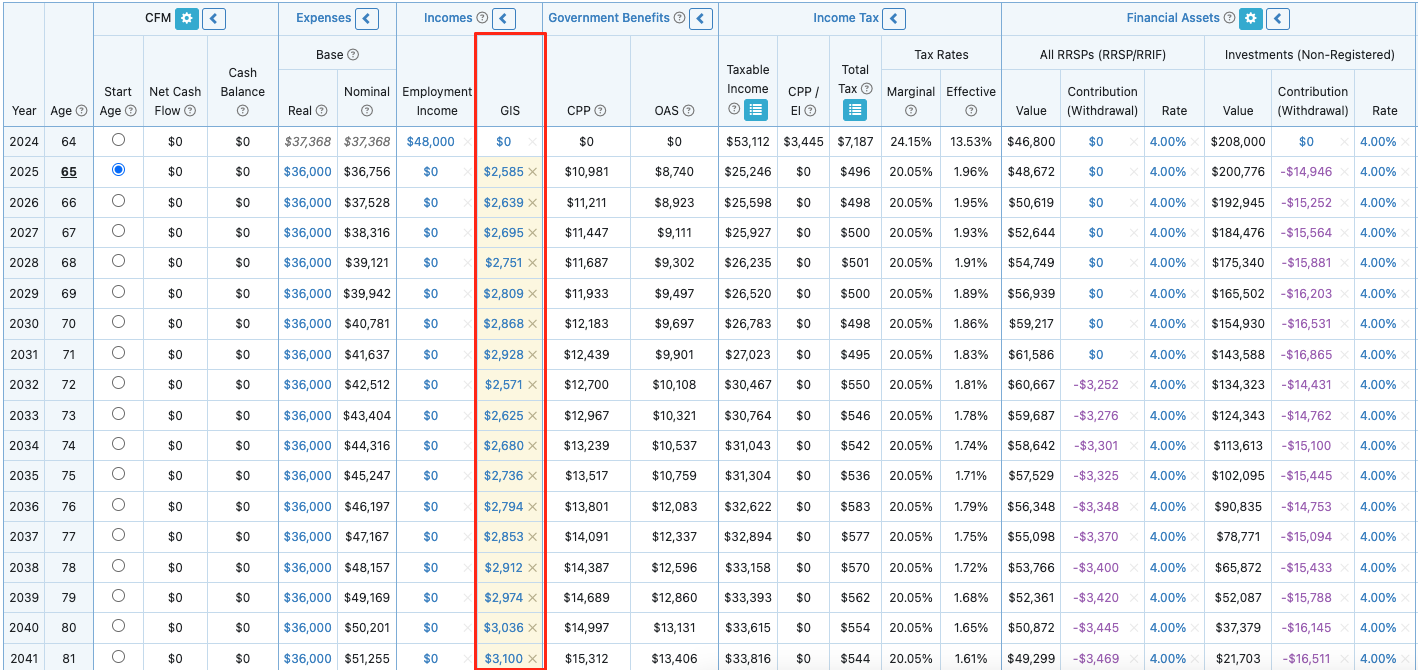
In this simple example, John is retiring this year and expects to start receiving his government benefits next year when he turns 65. He has no employment or self-employment income when he retires. John is single and has resided in Canada exclusively during his life. He expects to receive 65% of the maximum benefit for CPP, 100% of the OAS benefit, and will draw from his non-registered assets to support his desired annual Base Expenses amount of $36,000.
|
|
|
|
|
|
|
|
|
|
|
|

- 5
-
Prefer to watch a video?
This 15 minute video features Leigh Martinson, Customer Success Manager with Snap Projections, and Jason Watt, Instructor at Business Career College walking through a few examples of incorporating GIS in your projections. This video is also shared by Jason as part of his Retiring on Low Income pro-bono course for anyone to take free of charge. To access the course please perform the following steps.
- Go to www.businesscareercollege.com
- Either Sign In (if you have an account) or Sign Up (near the top right) for a free account. If signing up, select Create Learner Account.
- Once logged in, go to My Courses and click the User Enrolment key button at the top right.
- Provide the Enrolment Key retiring-on-low-income-indigo-2771